Making A Horizontal Bargraph Using JavaScript and D3 (PART 1)
Thu, Aug 13th, 2015
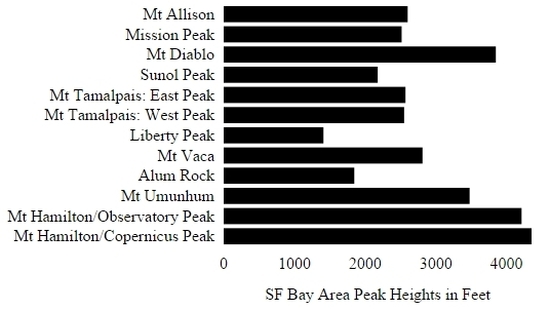
Bar Graph Made Using JavaScript and D3
The purpose of this document is to describe the process in building a bar graph using the D3 JavaScript library. This tutorial assumes you have some HTML and JavaScript experience. I will use the words method and function interchangeably. I will also only offer brief explanations as to how I am coding this and recommend to learn additional information by reading the D3 API documentation. As stated on the D3 website, http://d3js.org/ D3.js is a JavaScript library for manipulating documents based on data.
A Simple Start
I will start simple and focus just on accessing the data and simple DOM manipulation with D3. Below is the basic HTML 5 webpage I will start with named index.html. Notice the script tag which includes
d3.js. Alternatively, you could link to the latest version of D3 by specifying the URL below which was
obtained from the D3 website.
<script src="https://cdnjs.cloudflare.com/ajax/libs/d3/3.5.6/d3.min.js" charset="utf-8"></script>
The following is the basic HTML page I start with:
<!DOCTYPE html>
<html lang="en">
<head>
<meta charset="utf-8">
<script type="text/javascript" src="../d3/d3.js"></script>
</head>
<body>
</body>
</html>
The data is contained in a CSV file called sfbaypeaks.csv. It is a listing of the heights of some of the SF Bay Area peaks. CSV stands for comma separated values. This file format delimits each piece of data with a comma. The first line is a header that contains a descriptive word for each column of data. There are four columns of data in this file: name, GNIS ID, county and height(feet).
The contents of sfbaypeaks.csv
name,GNIS ID,county,height(feet)

Mount Allison,218152,Alameda,2602

Mission Peak,228839,Alameda,2517

Mount Diablo,222343,Contra Costa,3849

Sunol Peak,1723545,Alameda,2178

Mount Tamalpais: East Peak,222916,Marin,2571

Mount Tamalpais: West Peak,1660148,Marin,2552

Liberty Peak,1808946,Marin,1411

Mount Vaca,255187,Napa,2812

Alum Rock,218197,Santa Clara,1847

Mount Umunhum,236770,Santa Clara,3478

Mount Hamilton/Observatory Peak,224848,Santa Clara,4213

Mount Hamilton/Copernicus Peak,1658314,Santa Clara,4354
In the CSV file I am only interested in the name column and height(feet) column. To begin, I just want to display these pertinent data, into the DOM by appending paragraph elements containing name and height information from the file. I realize this is not a very amazing start but, if this step is successful, I am assured that my data access code is correct and that I am not having server problems.
Here is how the documents are stored on my server:
index.html will be in a directory called sfbaypeaks
sfbaypeaks.csv will be in a directory named csv
d3.js will be in a directory called d3.
The following script is added to the body of the HTML document.
<script type="text/javascript">
	var width = 600;

	var height = 300;

	//Adds a SVG element in to the body of the page

	var svg = d3.select("body").append("svg").attr("width", width).attr("height", height);

	function drawGraph()

	{

		d3.csv("../../csv/sfbaypeaks.csv", convert, function(myData){

			myData.forEach(function(d){

				d3.select("body")

				  .append("p")

				  .text(d["name"] +" "+ d["height(feet)"] +" ft.");

			});

                });

	}

	//Convert the strings representing the height into numeric values

	function convert(d)

	{

		d["height(feet)"] = parseFloat(d["height(feet)"]);

		return d;

	}

	drawGraph();
</script>
The graph will be drawn inside a SVG element. SVG stands for scalable vector graphics. SVG graphics are graphics that can be scaled up or down without loss of image quality. First, I created the variables width and height for the width and height of the SVG element respectively. Next, I use D3 to add a SVG element to the DOM.
d3.select("body").append("svg").attr("width", width).attr("height", height);
With D3 it is very easy to select elements of the DOM and make changes. The line of code above selects the body tags of the DOM and appends a SVG element to it. Then, using method chaining, the width and height attributes are added to the SVG element. Now, that there is an SVG element to draw graphics to. Next, I make a function called drawGraph that will draw the graphics to the SVG element. But first,
inside this function, I will just use D3 to append data from the CSV file to the DOM within paragraph tags. To read in the contents of a CSV file you can use the d3.csv method. This method will store the contents of the file in an array. The first argument takes the name of the CSV file. The next argument, which is optional, is a function that works on the data contents of the file. In this case, my function named convert, converts the strings that represent the peak heights into numeric values. If you do not do this, d3.csv will write the heights as string values in the resulting array. The third argument is an
anonymous function that works on the resulting array that d3.csv creates. In this case, I gave the array the name myData. This array will be an array of JavaScript objects which will have fields named after the data descriptors named in the header line of the CSV file. Below is a representation of myData showing only the first two objects.
myData = [

  {name: "Mount Allison", GNIS ID: "218152",county: "Alameda", height(feet): 2602},

  {name: "Mission Peak", GNIS ID: "228839",county: "Alameda", height(feet): 2517}

]
Next, I append paragraph elements to the DOM using a forEach loop, d3 DOM selection and appending as before.
myData.forEach(function(d){

   d3.select("body").append("p").text(d["name"] +" "+ d["height(feet)"] +" ft.");

});
Notice the method selection and append chain is used just as before. The anonymous function passed to the forEach loop works on each element of the myData array. The fields of each object are selected from the array using d["field_name"].
With D3, there is another way to loop through the data and append selected fields of each object to DOM elements. After making the DOM selection you can use the d3 data method to attach the data array to the d3.selection and then the enter method to work on new elements to the DOM. In this case, the new DOM elements are the paragraph elements we will append to the body of the HTML document. I changed the drawGraph function to reflect this different approach to looping through the data.
function drawGraph()

{

   d3.csv("../../csv/sfbaypeaks.csv", convert, function(myData){

     d3.select("body")

       .data(myData) //attach myData to the current d3 selection

       .enter() //for each new element that enters the DOM

       .append("p") //add a paragraph tag

       .text(function(d){return d["name"] +" "+ d["height(feet)"] +" feet.";});

   });

}
By the way, attributes can be added to the paragraph tags that contain the data by using the D3 attr method. To change the color of the text for example, add the following to the chain after the text method:
.attr("style", "color:blue");
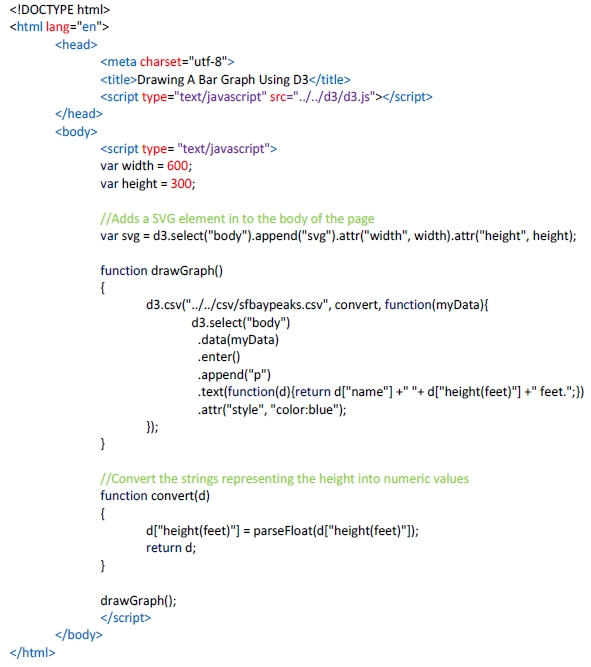
Here is a screen shot of the full code thus far:
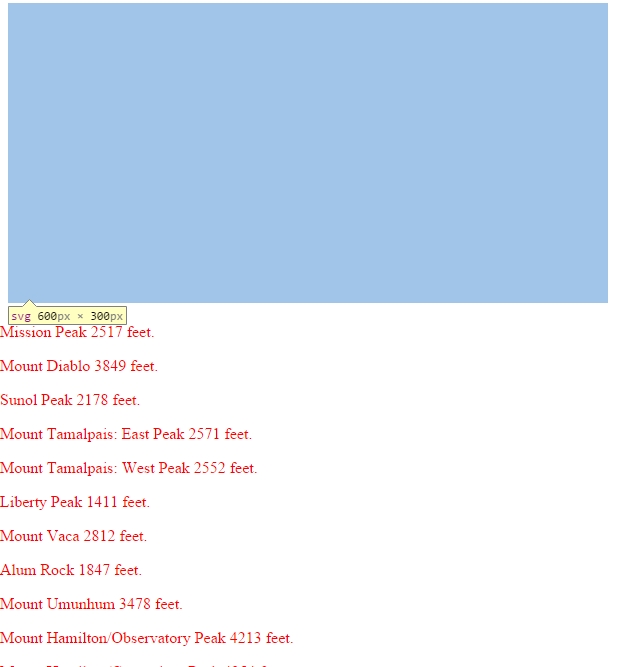
And the figure below shows the output with the text colored red (not blue as shown in the code). I highlighted the SVG element so you can see the space it occupies on the web page. This is exactly what I wanted, an empty SVG element and paragraphs displaying text below it. At this point I know I am accessing the data correctly and that my JavaScript code is drawing an SVG element. Next, I will draw SVG rectangles to the SVG element using the data array myData.
This concludes part 1 of this tutorial. In the next section the I will draw the bar graph by drawing rectangles in a SVG element. The length of each rectangle will vary depending on the height of the peak as specified in the CSV file.
If you can't wait for the the next part to be published, you can read the full tutorial here:
LINK TO FULL TUTORIAL